Shipped
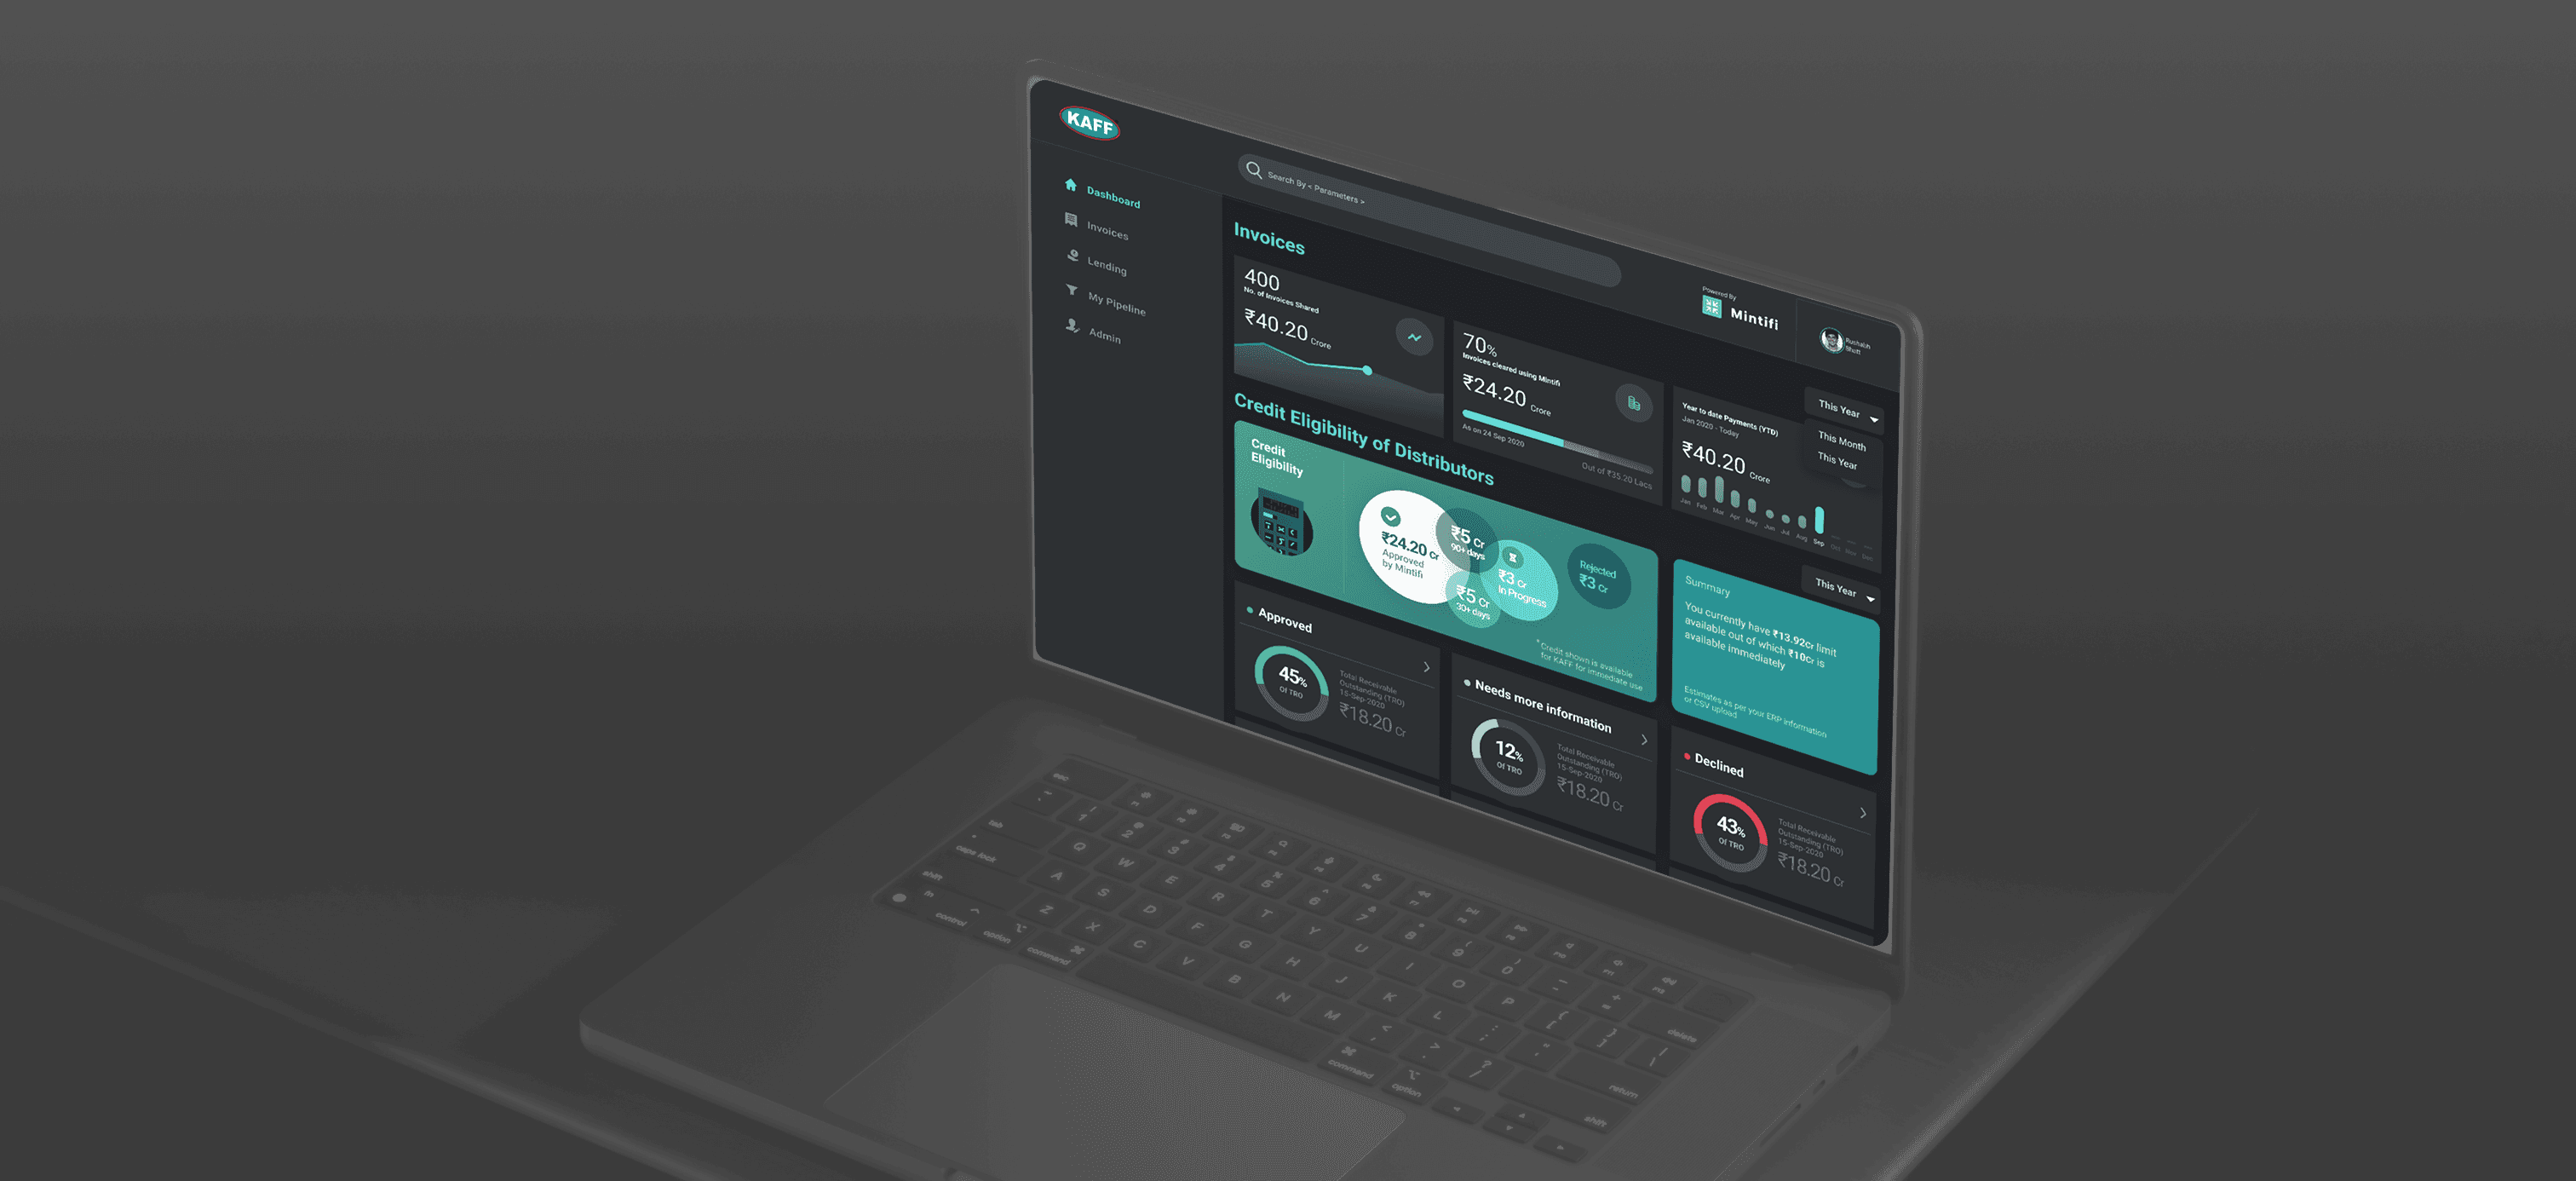
Mintifi Anchor Portal
Redesigned Mintifi’s Anchor Portal to streamline access to credit,
invoices, and vendor data for faster, informed decision-making.
I worked as a UX and UI designer for Mintifi’s Anchor Portal – a unified platform for anchors and borrowers to manage credit, invoices, and onboarding.
Conducted user interviews to identify pain points and define MVP requirements, and created wireframes in close collaboration with stakeholders under the guidance of Lead Designer Abhishek Sharma.
Product
Mintifi Anchor Portal
Skills
Product Design
Heuristic UX Audit
UX Research & User Interviews
MVP Definition
Feature Prioritization
Wireframing, UI Design & Prototyping
My Role
UX & UI Designer
Timeline
Q1 2021
What is Mintifi ?
One-stop platform for supply chain credit
Mintifi is a fintech platform that streamlines supply chain financing for SMEs by offering collateral-free credit, purchase financing, and digital invoicing—enabling businesses to manage inventory, payments, and vendor relationships seamlessly.
Some Numbers for context
100+
Brands
700+
Anchors
$3bn Invoice
Processed Annually
What is an anchor portal ?
One dashboard for all anchor workflows—credit, invoices, and performance
Mintifi’s Anchor Portal is a digital platform tailored for enterprise “anchors” (brands and large corporates) to efficiently manage their supply-chain financing operations—enabling them to monitor and approve distributor credit lines, invoices, and vendor performance all in one place.
Brands
Anchor portal
Borrower
Mintifi
Context
One-stop platform for supply chain credit
Although invoice tracking and credit dashboards may not seem glamorous, they’re vital to Mintifi’s B2B lending ecosystem—where timely, accurate visibility can directly impact credit decisions. The initial request was simple: clean up how credit status and invoice data are shown. But based on my experience in complex B2B workflows, I suspected deeper issues. I initiated conversations with anchors, borrowers, and the product team to understand how these tools were actually being used. It quickly became clear that users were stitching together fragmented data from multiple sources—leading to confusion and delays.
Project Goal
Design and build a streamlined Anchor Portal experience that helps anchors:
Monitor and manage credit limits per vendor
Track invoice activity and repayment behavior
Make smarter credit allocation decisions based on data—by geography, season, or risk profile
Research
Understanding User Pain points
We spoke with 14 stakeholders, including 12 anchors and a few borrowers. What became clear was that the entire credit and invoice ecosystem was deeply fragmented. Anchors had to manage scattered records across vendors and regions, making it difficult to spot credit risk patterns, optimize credit limits, or make seasonal planning decisions.
So instead of designing piecemeal screens, we pitched a complete redesign of the Anchor Portal—one that would give anchors actionable visibility into invoice data, credit usage, vendor performance, and regional trends.
Primary User Research
In depth Interviews
Secondary research on Bharat Users
Competitive Benchmarking
12 Anchors + 2 Borrowers
Tangible Insights on product MVP
Journey Mapping
Pain Point Mapping
Prioritizing pains, gains & consumer actions
Understanding Business painpoints
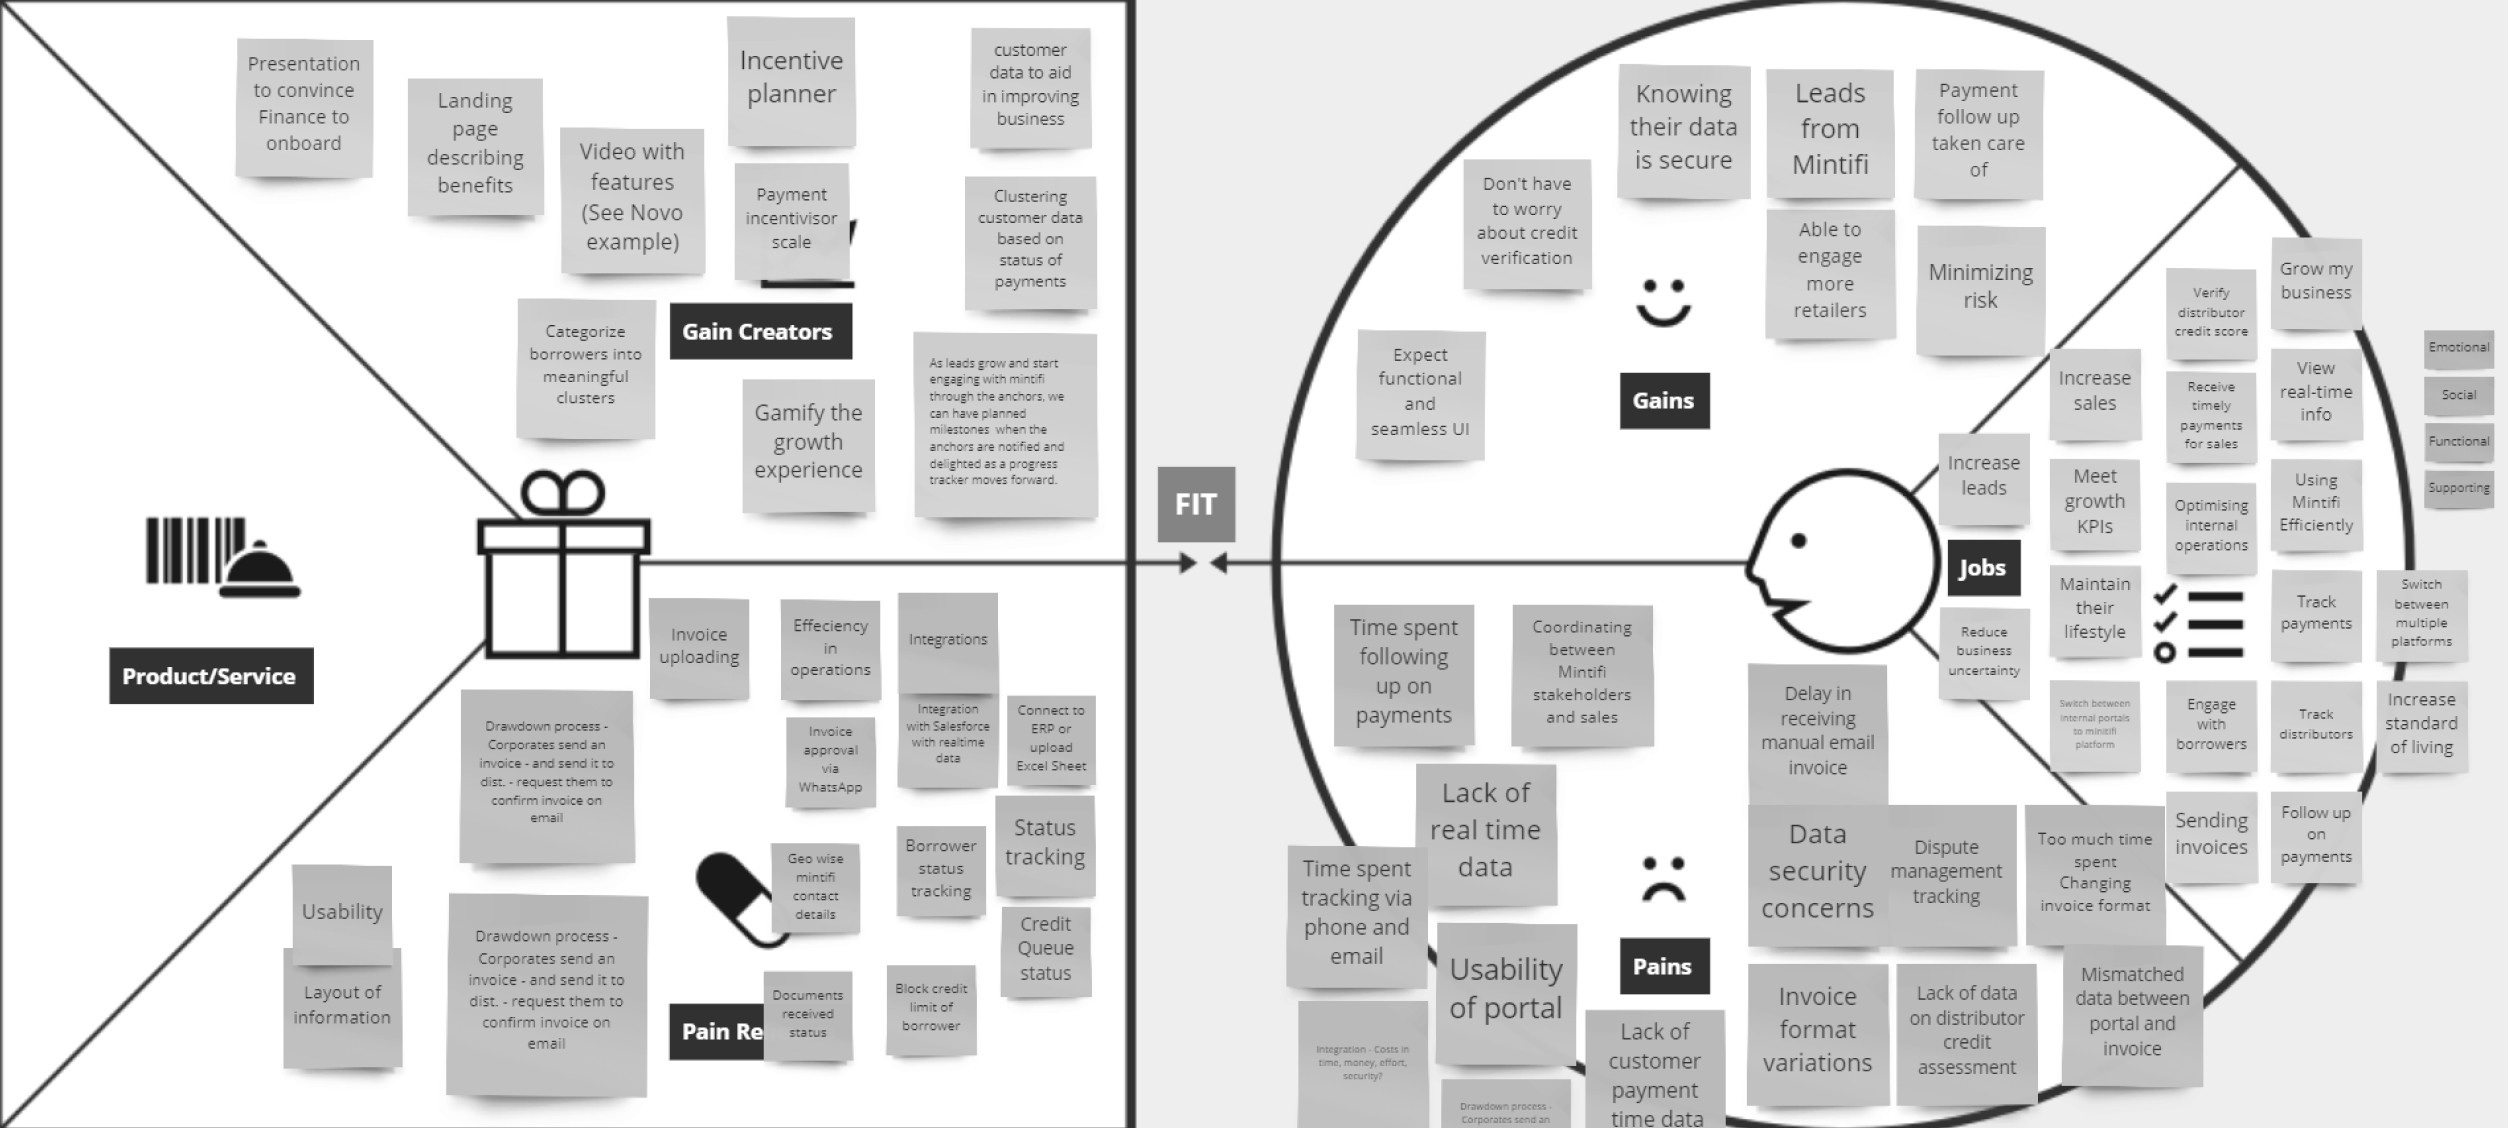
Value Proposition Canvas
A comprehensive workshop was conducted during user interviews to help ensure that any new product or service is positioned around what the customer values and needs. The insights were later filtered and prioritized based on user inputs.
Streamlined credit & invoice management – Replaced fragmented, manual processes with real-time dashboards, reducing delays, mismatched data, and manual follow-ups.
Risk reduction & trust building – Provided secure data handling, proactive borrower status tracking, and timely payment visibility, minimizing uncertainty and strengthening confidence.
Growth enablers for anchors – Introduced incentive planning, customer clustering, and gamified progress tracking to help anchors engage more retailers and meet growth KPIs.
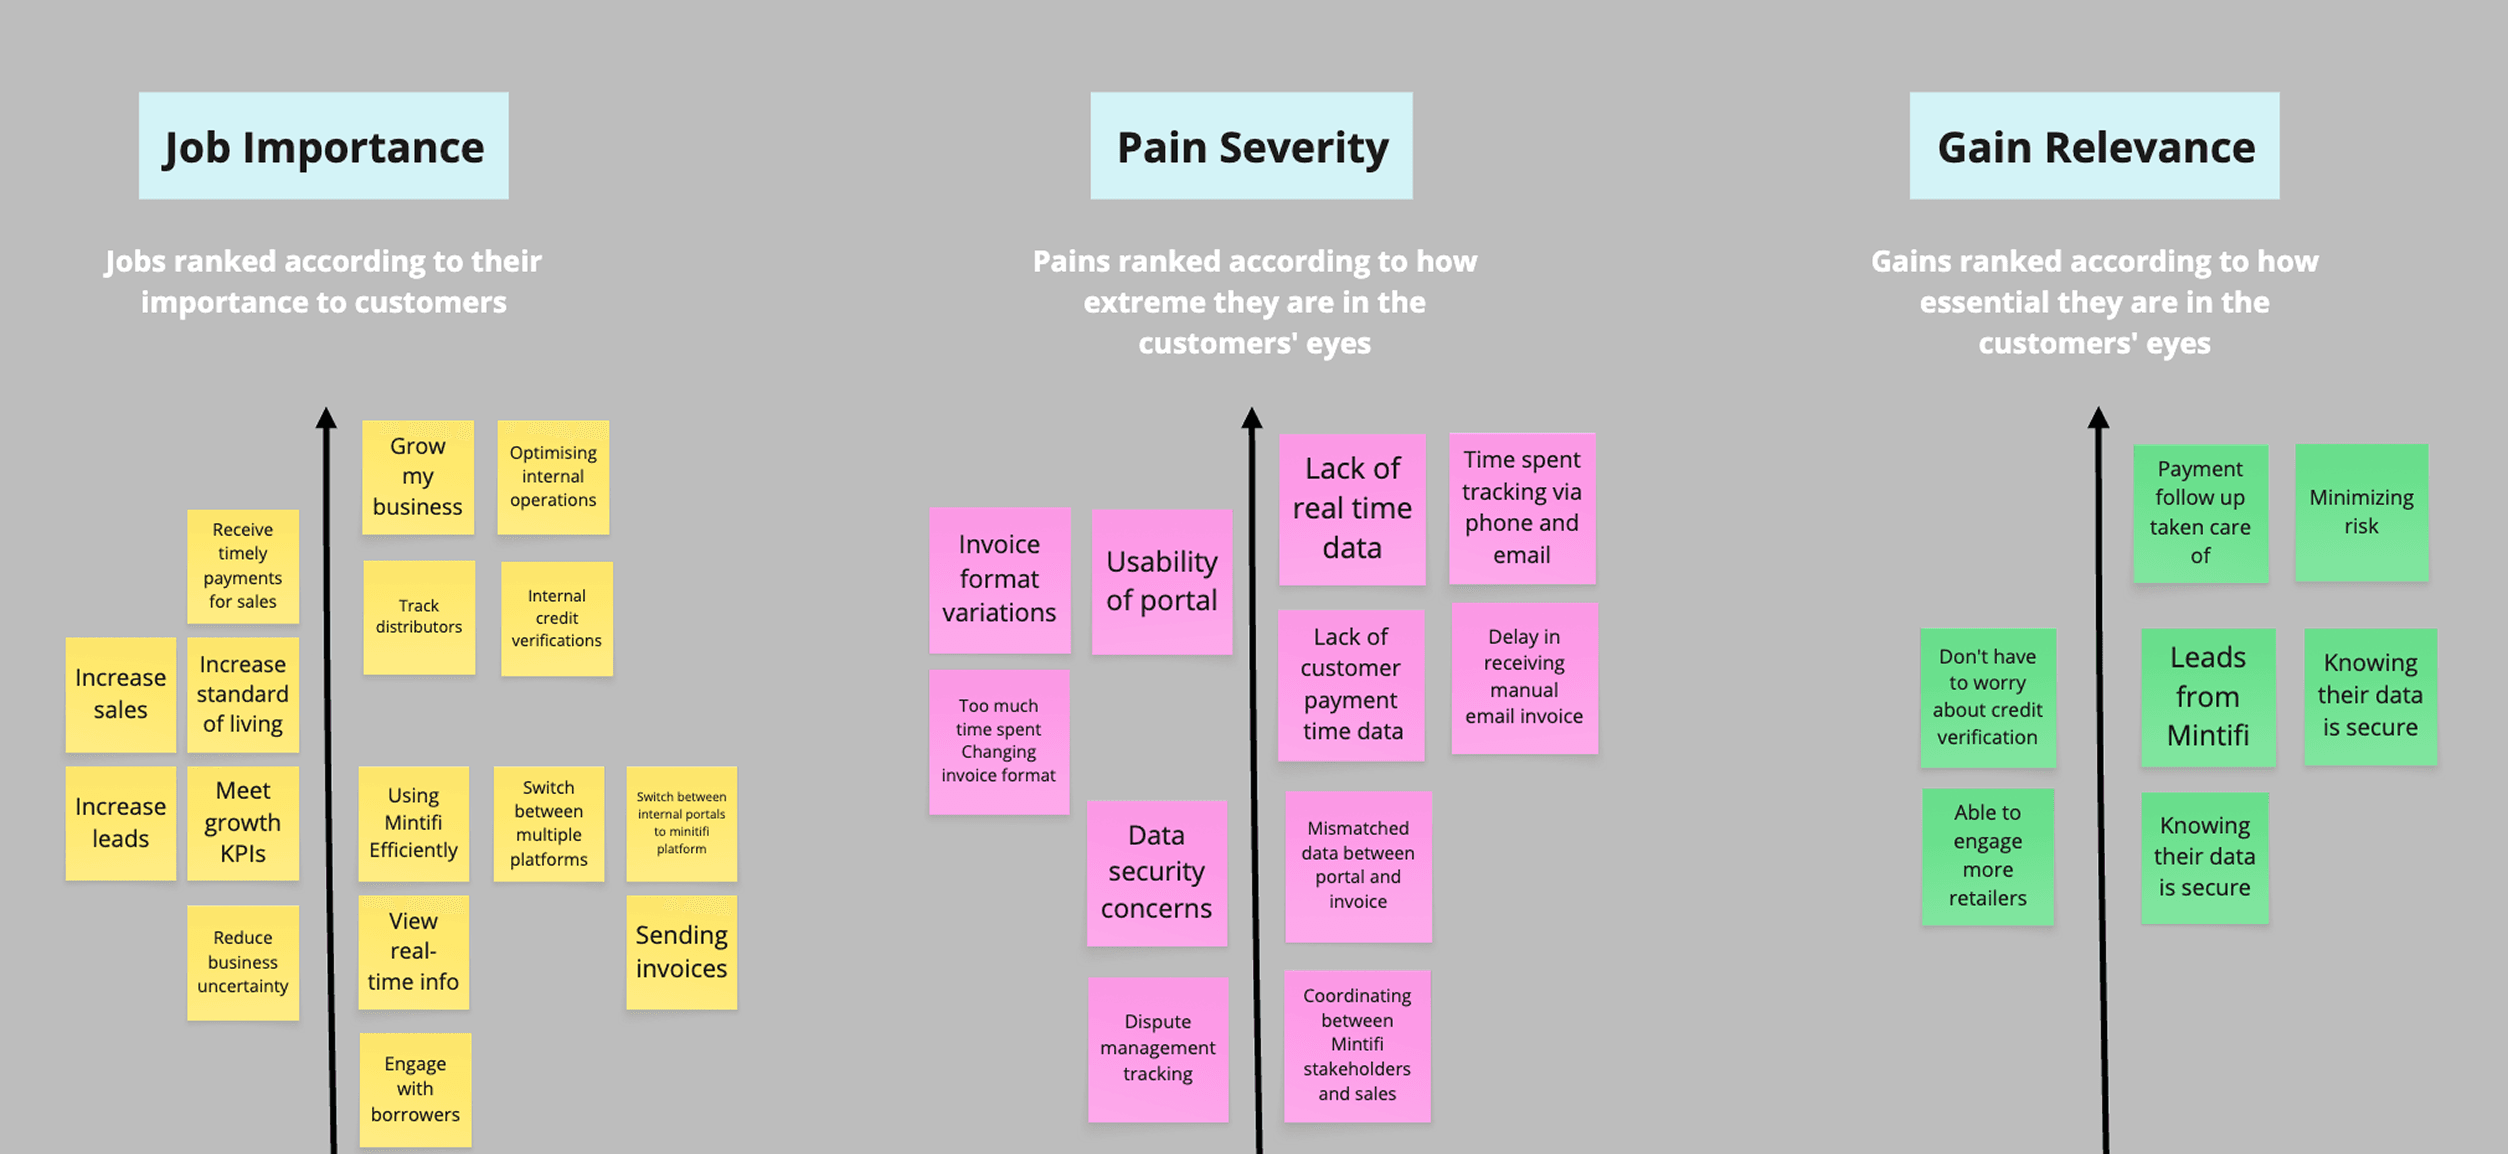
Understanding Business painpoints
Putting things in perspective
After synthesizing similar insights using the Value Proposition Canvas, we moved forward with internal prioritization of key features based on our understanding. To validate and refine these priorities, we conducted interviews with key stakeholders—Mr. Pankaj Sethi (CFO, KAFF), Mr. Narsimha (Nippon), and Mr. Sriram (AMCO). During these conversations, we asked them to rank features based on relevance and impact. These interviews not only confirmed many of our initial assumptions but also surfaced critical insights that informed the next phase of feature design.
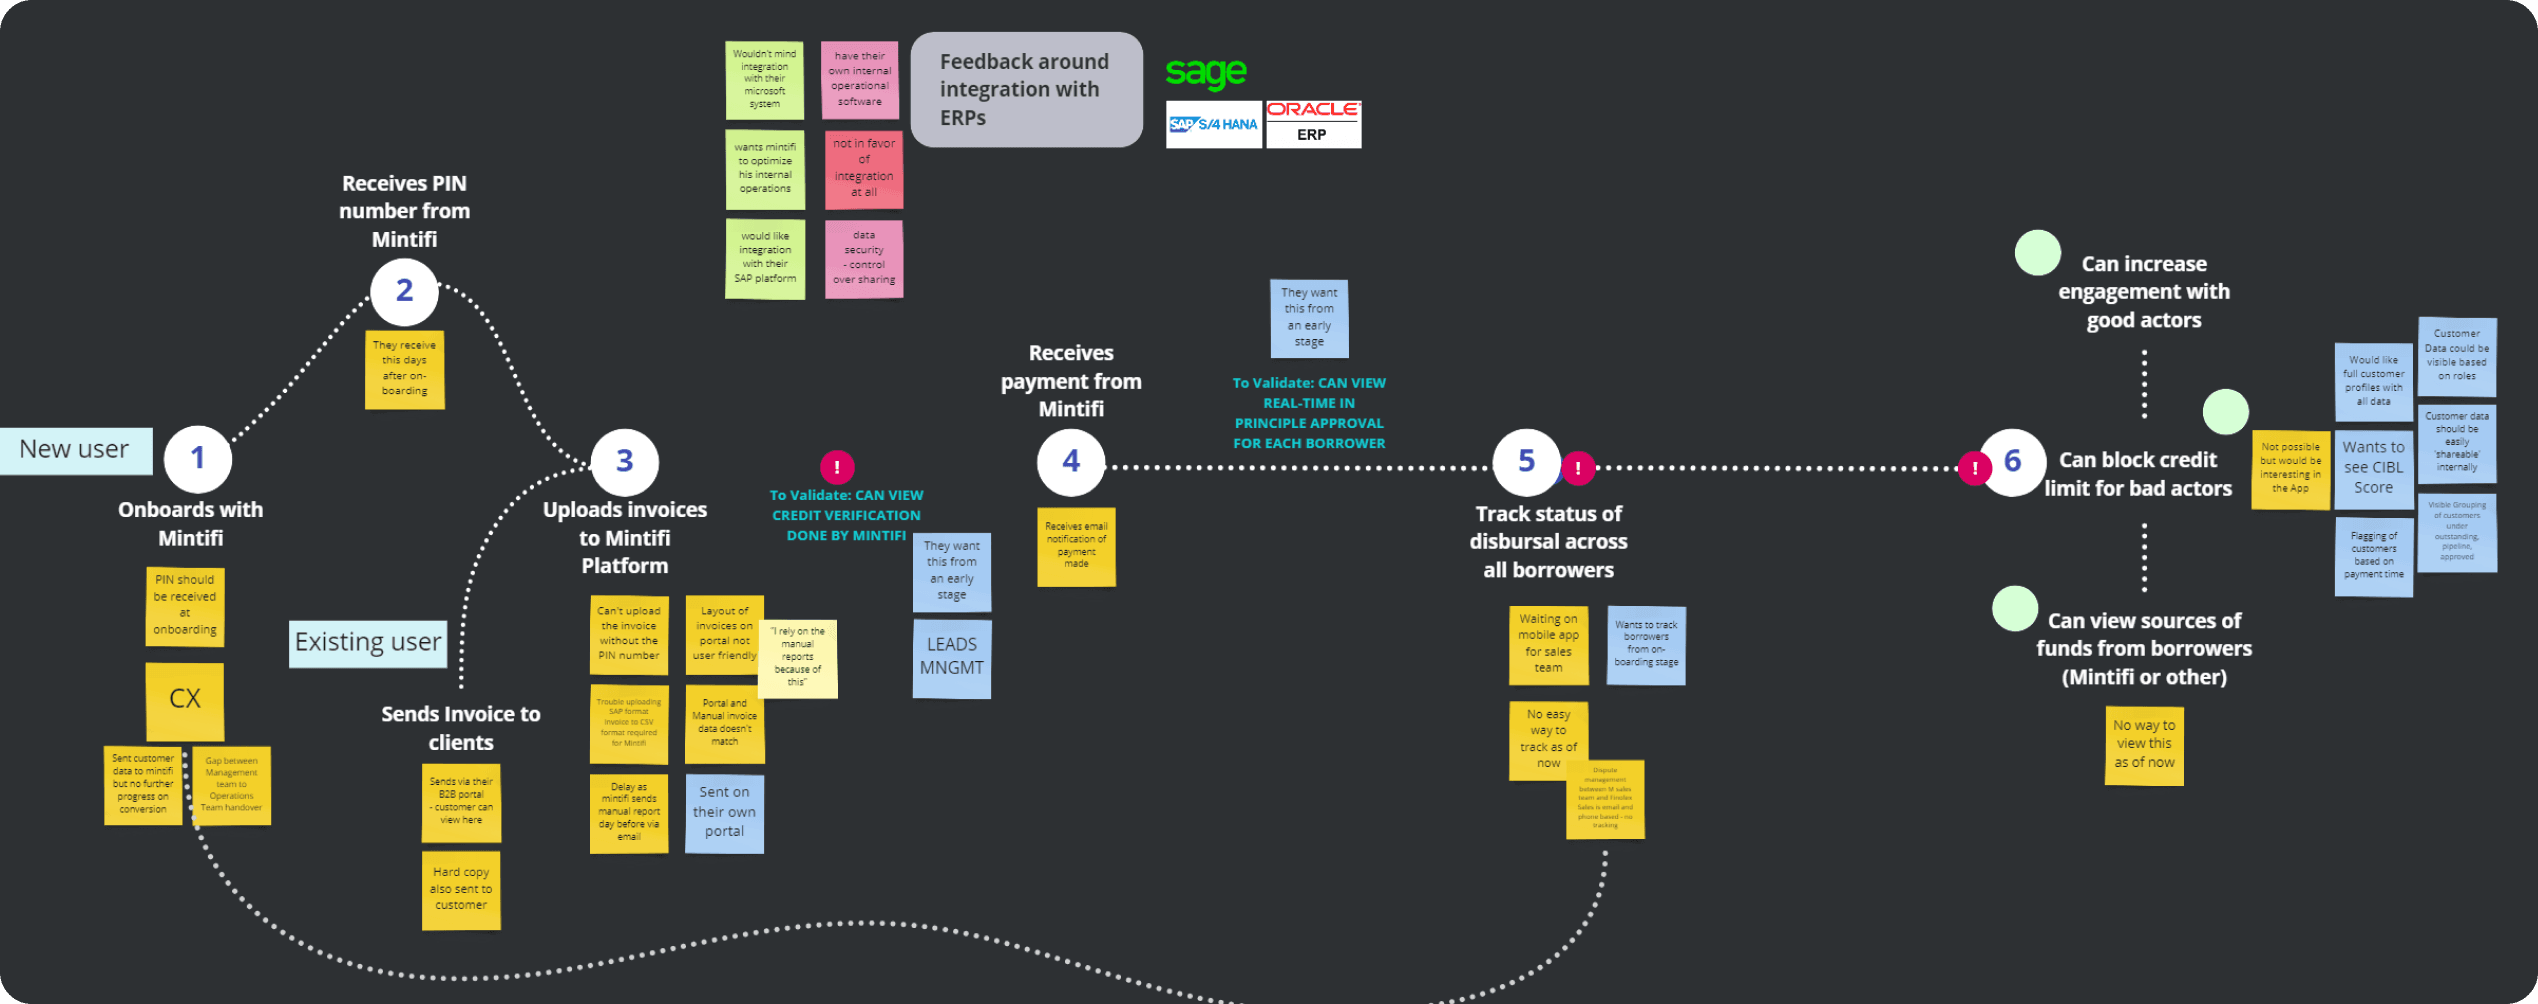
Mapping out the journey
Putting things in perspective
Based on exploratory interviews, we mapped out a journey depicting the anchor’s interaction with Mintifi’s service from on-boarding to various stages and use cases. We then flagged our user-based insights against each stage of the journey.
Project Goal
Anchors needed ERP integration to upload Invoices. Mr. Narsimha mentioned “ Very difficult to upload SAP when Mintifi needs CSV
Can View real time principal approved for each borrower
Can adjust credit allowance real time based on repayment, more for good actors, less for bad actors. This would ensure more secured credit disbursed by Minitifi, and more order value for the anchors
Summarizing our insights
Putting things in perspective
Making Data easily consumable for better insights and actionables
Making sense of tons of data tables was one of our topmost priority, this hindered anchors ability to disburse credit limit for the right vendor at the right time, make timely followups on invoice payments, and helped identify bad actors in the system
Region wise Credit Distribution and Utilisation
India being such a diverse country, needed a way to determine how consumption and order pattern change through seasons -”in Diwali season, north India sees a consumption jump of around 1.5x, would be good to give 2x credit limit during that time to distributors”
Easy Integration with ERP’s and easy invoice management tool
Getting a one stop solution for uploading, sending invoices, and reminders was the next big priority, reducing the current back and forth on mail, which led to mismatched data a nd a lot of manual paperwork.
Final Designs
Where everything comes together
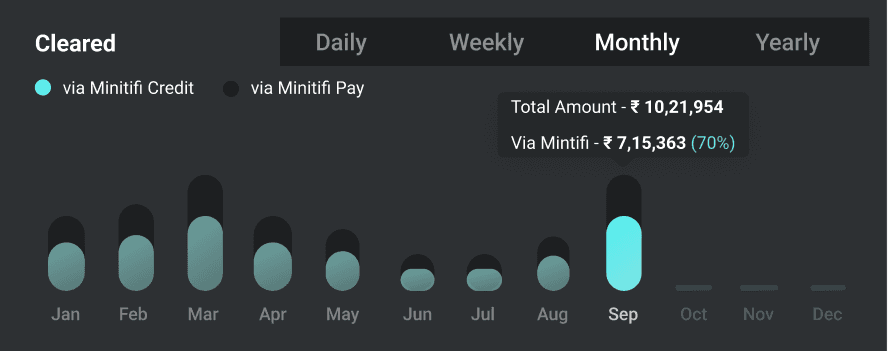
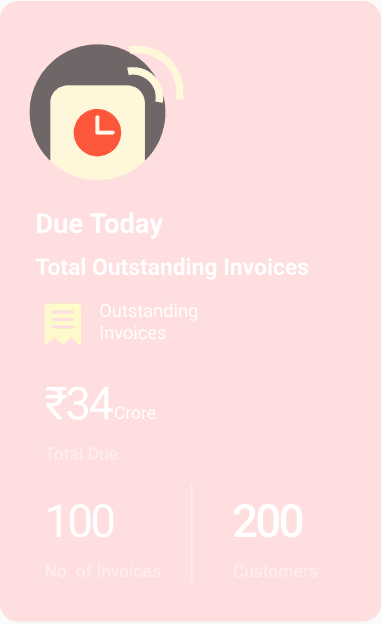
Making Data easily consumable for better insights and actionables
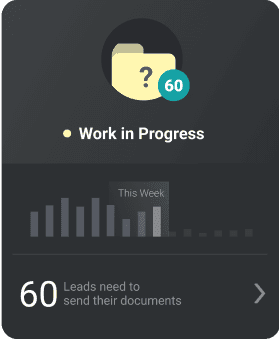
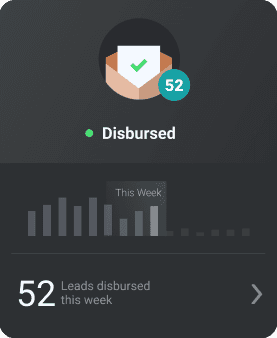
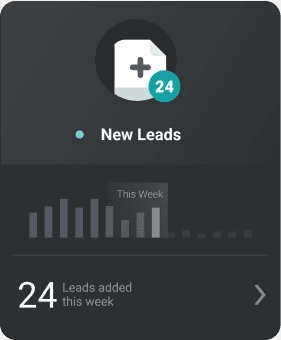
We used data visualization and a widget-style dashboard to turn complex tables into scannable insights. Anchors could customize their view, prioritize relevant information, and act faster on credit disbursals and payment follow-ups.

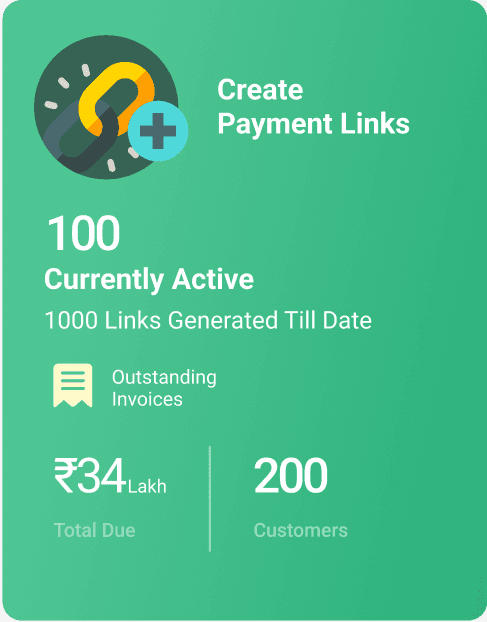
Easy invoice management tool
Getting a one stop solution for uploading, sending invoices, and reminders was the next big priority, reducing the current back and forth on mail, which led to mismatched data and a lot of manual paperwork. We also added easy integration with ERP’s


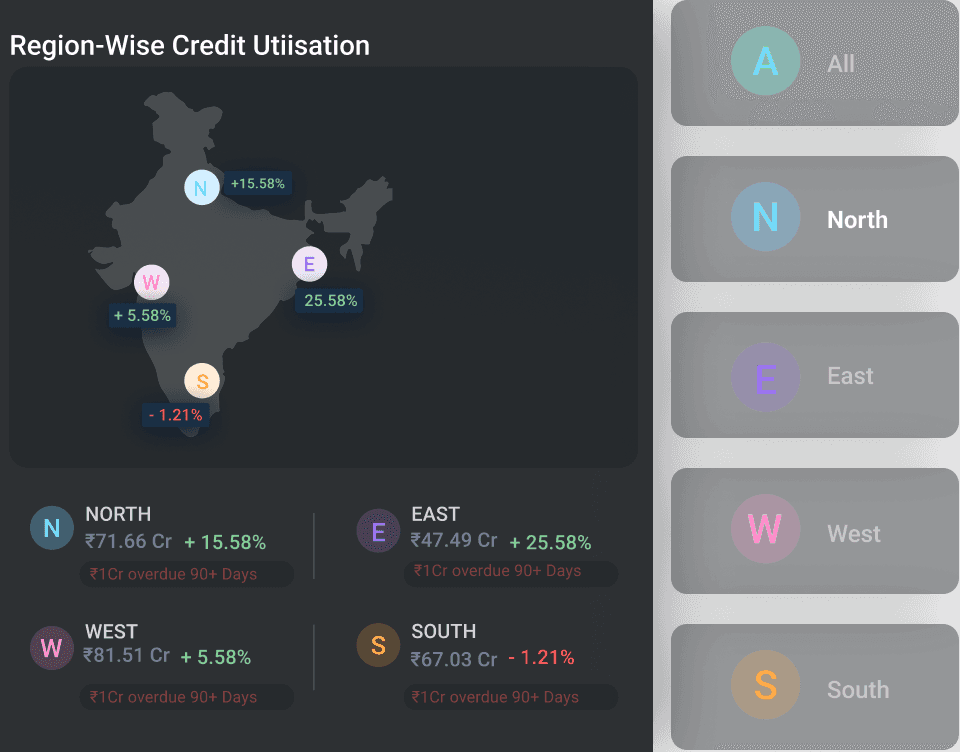
Region wise Credit Distribution and Utilisation
India being such a diverse country, needed a way to determine how consumption and order pattern change through seasons -”in Diwali season, north India sees a consumption jump of around 1.5x, would be good to give 2x credit limit during that time to distributors”


Learnings & Reflections
Working on Mintifi was a transformative experience that deepened my understanding of designing for complex financial ecosystems. I learned the critical role real-time data plays in proactive risk management and how design decisions directly influence business strategies. Collaborating closely with diverse stakeholders reinforced my ability to communicate clearly and effectively bridge business goals with user needs.
Impact
Post-launch, our design significantly streamlined Mintifi's credit management processes, replacing fragmented manual workflows with intuitive, real-time dashboards. Anchors reported noticeable reductions in errors and quicker decision-making, directly enhancing their distributor relationships and operational efficiency. The introduction of proactive risk-tracking allowed businesses to better manage potential defaults, directly contributing to improved financial outcomes.
Recognition & Accolades
The project's success was recognized internally, with leadership commending our team’s ability to quickly adapt to challenges and deliver impactful results under tight deadlines. Additionally, positive feedback from Anchors—who experienced immediate improvements in their daily tasks—remains one of the most rewarding outcomes of this project.